The following images are from a paper by Kevin Zahnle (NASA Ames Research Center)
and Mordecai-Mark Mac Low (University of Chicago) titled "The Collision
of Jupiter and Comet Shoemaker-Levy 9." These images are from a computer
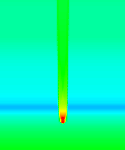
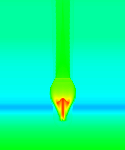
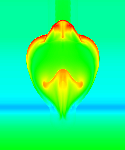
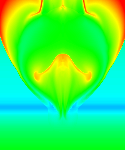
simulation of a 10^28 erg comet explosion in Jupiter. Colors represent
temperature: blue for the coldest and red for the hottest. The blue
horizontal line towards the bottom of each image represents the Jovian
tropopause.
Clicking on any image below will display the full-sized version.
10 seconds:

30 seconds:

50 seconds:

90 seconds:


